
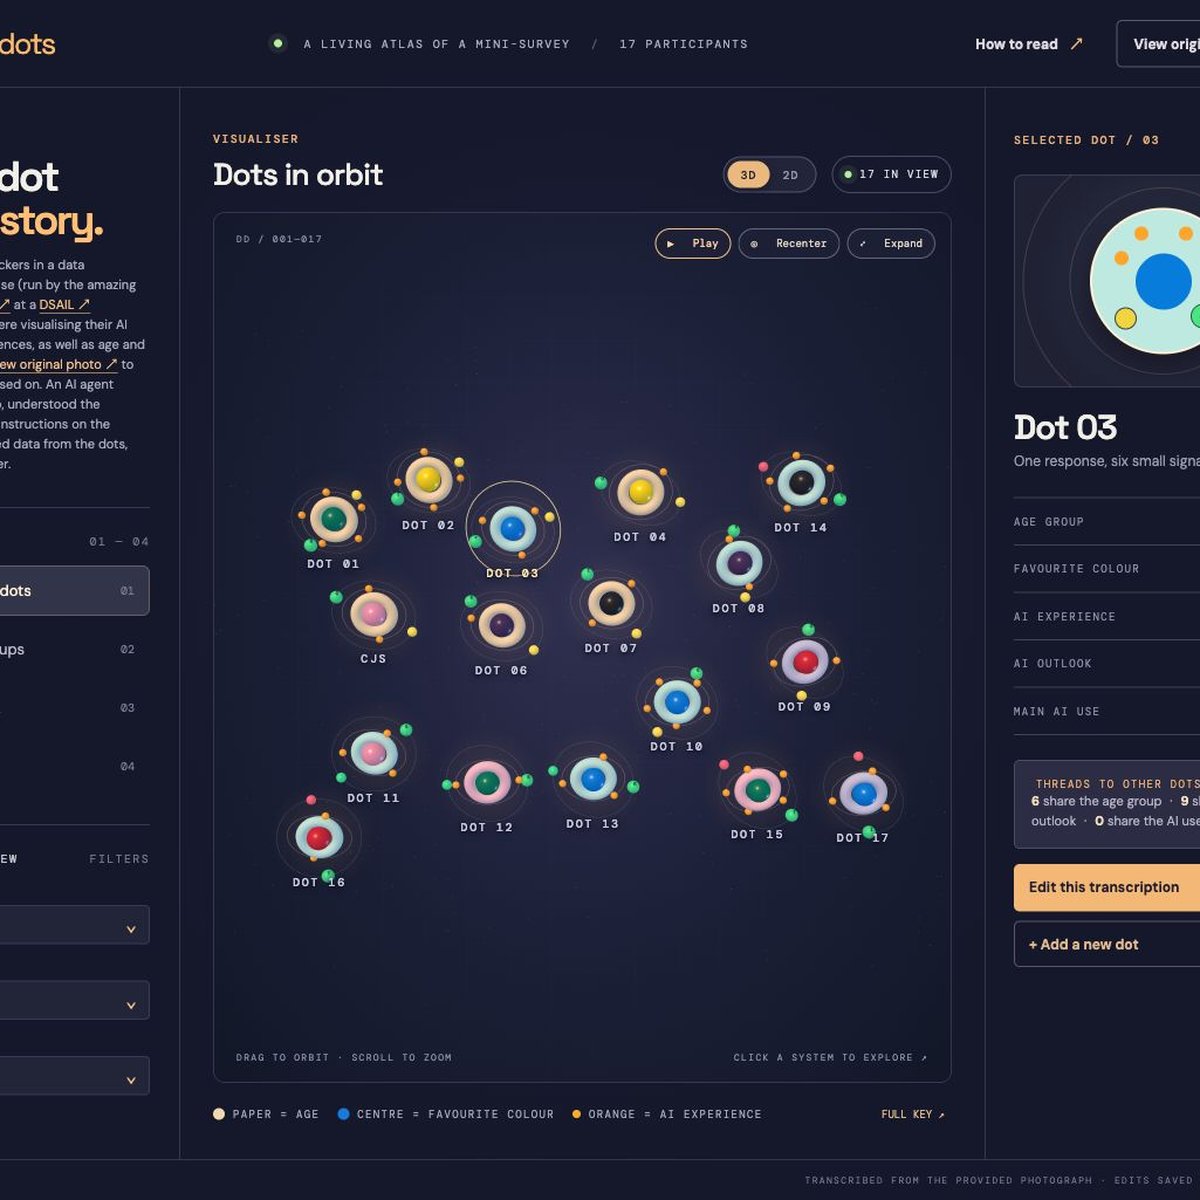
I’ve made a new prototype for the Design Research Playground. Data Dots turns a photograph of hand-drawn survey responses into an interactive atlas of AI experience, outlook and preferences.
At a DSAIL showcase, seventeen people used stickers to visualise their AI experience, preferences, age and favourite colour, in an exercise run by Emma Charleston. An AI agent interpreted a photograph of the results along with the leaflet key, transcribed the responses and built the viewer. Some of its readings are uncertain, so those are marked for review.
Each response becomes a miniature solar system, which you can explore in an animated 3D view or a flatter 2D atlas, and you can compare everything against the original photograph to see how well the agent did.